
Source: Financial Times
Alan Greenspan, the then Federal Reserve chairman nicknamed The Oracle for his economic soothsaying, told the US Senate on July 21 2005 to disregard an obscure glitch in markets that some fretted could portend an economic slowdown. The so-called “yield curve” was obsolete, he declared. “The evidence very clearly indicates that its efficacy as a forecasting tool has diminished very dramatically because of economic events,” Mr Greenspan confidently told the Senate Banking Committee.
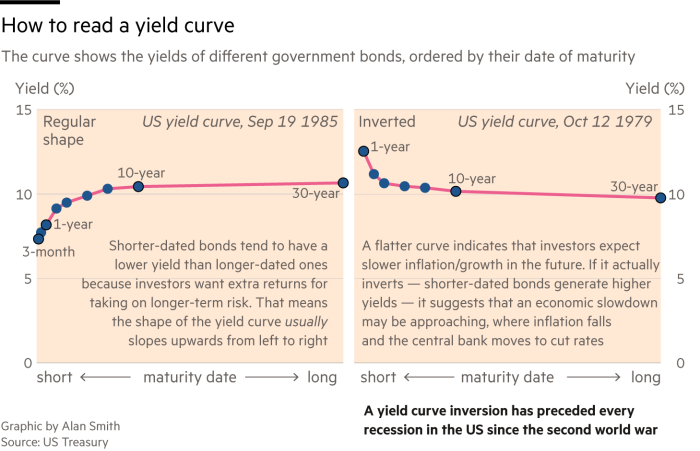
The yield curve is Wall Street’s original “fear gauge”, notching up a perfect predictive record before pretenders such as the Vix index were even glimmers in the eyes of financial engineers. Typically, countries pay less to borrow for three months than five years, and less for five years than for a decade — after all, investors want some compensation for the gradual erosion of inflation, or the risk, albeit faint, that a government could renege on its debt. Plotted on a graph, the bond yields of various maturities form a “yield curve” that most of the time slopes gently upwards.
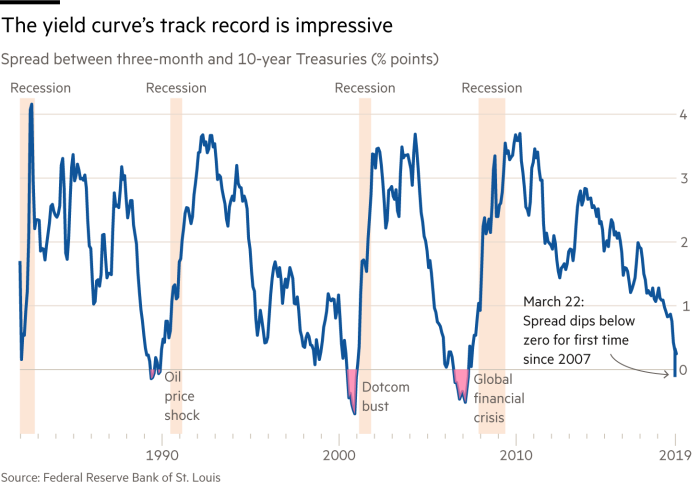
But sometimes short-term yields rise above longer-term ones, an “inversion” of the usual shape of the curve that has been an uncannily accurate harbinger of recessions, preceding every downturn since the end of the second world war. For instance, when Mr Greenspan in 2005 read the last rites for the yield curve’s predictive powers, the three-month Treasury bill yield was still 0.9 percentage points below the 10-year Treasury yield. A year later the curve inverted and 18 months after that the US economy entered its worst recession since the 1930s.
Ominously, the US yield curve has now inverted once again, with the 10-year Treasury yield on March 22 dipping below the three-month T-bill yield for the first time since 2007. Combined with the length of the post-crisis expansion — this summer it will become the longest growth spurt in US history — and deteriorating economic data, the inverted yield curve has stirred fears that the countdown to the next downturn has already begun.
“The curve has been flattening and sending a warning signal for some time,” says Douglas Peebles, head of fixed income at AllianceBernstein. “I’m a yield curve junkie and I don’t think you can ignore that.”
But it is a complicated soothsayer. Signs of steadier growth have now lifted the yield curve back into positive territory, and investors and economists remain relatively sanguine, arguing that there are market forces at play that are distorting the curve’s message.
“I’m not worried,” says Mohamed El-Erian, chief economic adviser at Allianz. “The yield curve’s signal is not what it used to be.”
This was at the back of Campbell Harvey’s mind when he was considering doctoral dissertations at the University of Chicago in 1983. A summer internship at a Toronto mining company had hammered home how useful it would be for companies to have a better market indicator to gauge the economic outlook, but reams of research had also amply demonstrated the stock market’s patchy record of prediction.
Inspired by an obscure 1965 paper noting how the yield curve undulated with the economic cycle, Prof Harvey realised this could be a much cleaner way of gauging recession risks. His thesis committee was initially sceptical, given the paucity of observations, but it has become part of the canonical work on the yield curve.
Its simplicity is a major reason for the scepticism, according to Prof Harvey, now a professor of finance at Duke University. “The model is really simple. It’s a point of attack” for critics, he says. “But it’s got a good record.”
In essence, the yield curve distils the wisdom of millions of investors, and their views of the current and future health of the economy. Individual fund managers may be wrong from time to time, but the overall judgment of a lot of smart people tends to be fairly accurate.
Longer-term bond yields are influenced by interest rates set by central banks, but mostly by the economic outlook. When investors think economic clouds are gathering, which will depress inflation, they tend to buy Treasuries, lowering their yields. And when they sink below short-term bond yields — which are more closely aligned to base interest rates — it is a strong indication that investors think monetary policy is too tight for the deteriorating health of the economy. That can precipitate a recession and force the central bank to cut rates again, buoying bond prices.
However, there are many forces that shape yields. And some could be causing the bond market’s soothsaying glitch to suffer a glitch itself, say economists and investors. “You are an idiot to ignore the yield curve but it is not proof that a recession is coming by itself,” says Seth Carpenter, chief US economist at UBS and a former senior Treasury and Federal Reserve official.
Post-crisis regulation encouraged banks to keep more money in ultra-safe assets, and it is hard to find anything safer than US Treasuries. The Fed is still sitting on $2tn of Treasuries acquired through bond-buying programmes, while negative interest rates and quantitative easing programmes in Europe and Japan have nurtured colossal demand for highly rated debt. Combined with secular forces such as technology and demographics subduing inflation, that keeps longer-term yields pinned down — almost irrespective of the economic situation.
At the same time the US government is financing much of its yawning budget deficit by issuing short-term bills rather than longer-term bonds. Combined with the Fed’s recent balance sheet shrinkage and interest rate increases, that has exerted tremendous upward pressure on Treasury bill yields.
This is why many fund managers prefer to use the two- and 10-year Treasury yields as a cleaner measure of the curve’s shape. This “spread” has remained positive, bouncing around between 0.1 and 0.2 per cent since last year. The two and 30-year Treasury spread, another popular measure, has actually steepened this year, muddying the yield curve’s signal.
Moreover, its predictive abilities seem to travel poorly. Japan, the UK and Germany have all seen inversions in the past without suffering recession. Some investors therefore argue that the yield curve preoccupation is overwrought. “The market has become overly obsessed with it,” says Kasper Elmgreen, head of equities at Amundi, the asset management company.
However, this does not negate the signal the yield curve is sending, according to Peter Fisher, a former top New York Fed and Treasury official, head of fixed income at BlackRock and now a professor at Tuck School of Business at Dartmouth. “The mistake is to think it is a predictor of recessions,” he says. “I think it causes recessions.”
He argues that a flat or inverted yield curve dampens the willingness of banks to lend. After all, their funding costs are tied to short-term interest rates. But when longer-term rates fall below their cost of financing, the incentive to lend is ruined. That then ripples through the economy and helps cause a recession, rather than merely predicting one.
Recent research by the St Louis Fed indicates that Prof Fisher’s causation argument may ring true, but it remains a minority view. Indeed, setting aside the bond market’s bout of nerves last month, most investors still seem fairly relaxed.
The US stock market took a beating on the day of the inversion, but has still enjoyed its best start to a year since 1998, and junk bonds — which should be particularly sensitive to any sign of weaker growth — have notched up their best quarter of returns in a decade. “The recent inversion of the US yield curve is a classic late-cycle, but not yet end-cycle, market indicator,” says Robert Buckland, chief global equity strategist at Citi. “History suggests it’s a reason to be wary, but not outright bearish.”
Prof Harvey’s research indicates only an inversion of at least three months is a reliable recession indicator. The curve briefly inverted in 1998, at the peak of the turmoil caused by Russia’s default and the blow-up of Long-Term Capital Management, but quickly normalised before a subsequent, more durable inversion in 2000 preceded the dotcom bust. The latest inversion only lasted five trading days.
Moreover, it can take a long time between an upside-down curve and an actual recession, and it appears that the delay is becoming longer. The shortest time was just one quarter, in 1957. The average lag is about five quarters, but the longest period between a negative yield curve and a recession was almost two years, and that was before the 2008 financial crisis.
This time it could take even longer. The Fed has now shelved plans to raise rates, and most analysts say growth is only slowing, not collapsing. The central bank’s own economists predict the pace of expansion will only decelerate slightly, to 2.1 per cent this year, 1.9 per cent in 2020 and 1.8 per cent in 2021.
Even self-confessed “yield curve junkies” such as Mr Peebles stress that any inversion should not trigger panic. “I’m not ignoring the yield curve, but for the time being I don’t think we have to be overly concerned,” he says.
Wary of the bond market jitters, the Fed’s top officials insist that the US economy remains in good shape, and argue that it is the yield curve that is malfunctioning.
“There are a lot of reasons to think that it has been a recession predictor for reasons in the past that don’t apply today,” John Williams, president of the New York Fed, said last week. Randal Quarles, the Fed’s vice-chair, attributed the twisted curve to the central bank’s balance sheet shrinkage. “I don’t view it as much of a harbinger,” he added last week.
However, there have always been various plausible reasons offered for why the yield curve is obsolete, and yet its record is spookily good — in fact, much better than the Fed’s. Prof Fisher points out that the only recession that the central bank has ever successfully forecast was the one it deliberately caused in the early 1980s, when then-chairman Paul Volcker ratcheted up interest rates to record levels to kill off inflation.
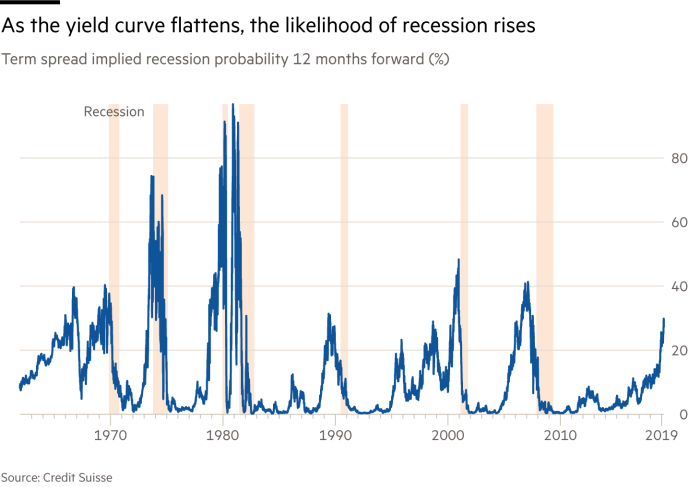
The New York Fed’s yield-derived model for calculating the probability of a recession over the next 12 months indicates that the odds on an economic downturn have shot up to 29 per cent, the highest since the beginning of 2007 — a higher probability than was seen a year ahead of five of the past seven recessions, according to Credit Suisse.
Prof Fisher fears the Fed and markets are complacent about the dangers. Paraphrasing the apocryphal saying about history often attributed to Mark Twain, he adds: “The yield curve doesn’t repeat itself exactly, but it has a rhythm.”