
Great paper put out by colleagues at UCLA, UIUC and Philly Fed on the topic of corporate bond liquidity during the Covid-19 pandemic. One of the more interesting findings was that not only did liquidity conditions improve for bonds that were eligible for the Fed’s lending/purchase programs, but also for bonds that were ineligible. Hence, by allowing dealers to unload certain assets from their balance sheet, the Fed’s interventions may have helped dealers to better intermediate a wide variety of assets, including those not directly targeted. As we’re not yet out of the woods with this pandemic, track historical liquidity metrics across the corporate bond universe using Overbond’s Liquidity Score.
Source: UCLA
Summary
- We study liquidity conditions in the corporate bond market since the onset of the COVID-19 pandemic.
- We find that in mid-March, as selling pressure surged, dealers were wary of accumulating inventory on their balance sheets, perhaps out of concern for violating regulatory requirements.
- As a result, the cost to investors of trading immediately with a dealer surged. A portion of transactions migrated to a slower, less costly process wherein dealers arranged for trades directly between customers without using their own balance sheet space.
- Interventions by the Federal Reserve appear to have relaxed balance sheet constraints: soon after they were announced, dealers began absorbing inventory, bid-ask spreads declined, and market liquidity started to improve.
- Interestingly, liquidity conditions improved for bonds that were eligible for the Fed’s lending/purchase programs and for bonds that were ineligible. Hence, by allowing dealers to unload certain assets from their balance sheet, the Fed’s interventions may have helped dealers to better intermediate a wide variety of assets, including those not directly targeted.
Background and Motivation
The COVID-19 pandemic has wrought havoc on the global economy. In mid-March, as both the scope of the pandemic and the duration of its effects became apparent, financial markets around the world entered a period of turmoil. As the price of equities and debt plummeted, reports of illiquidity in key financial markets emerged. 1 In the United States, the Federal Reserve responded with a variety of interventions aimed at different markets within the financial sector.
In this note, we attempt to shed light on recent trading conditions in one such market: the market for US corporate bonds. This market, nearly $10 trillion in size, serves as a primary source of funding for large US corporations. However, with the prospect of widespread downgrades and possible defaults, the cost of issuing debt increased dramatically in mid-March, and investors withdrew their money from corporate bond funds in record numbers. 2 In the midst of this turmoil, former Federal Reserve chairs Bernanke and Yellen described the corporate bond market as “under significant stress” (Bernanke and Yellen, 2020 [5] ), while a March 18 report from Bank of America deemed the market “basically broken” (Idzelis, 2020 [6] ).
In response, the Federal Reserve introduced several facilities to lower the costs of intermediating corporate debt and to bolster liquidity. On the evening of March 17, the Federal Reserve introduced the Primary Dealer Credit Facility (PDCF), offering collateralized overnight and term lending to primary dealers. By allowing dealers to borrow against a variety of assets on their balance sheets, including investment grade corporate debt, this facility intended to reduce the costs associated with holding inventory and intermediating transactions between customers. On March 23, the Federal Reserve proposed even more direct interventions in the corporate bond market through the Primary and Secondary Market Corporate Credit Facilities (PMCCF and SMCCF, respectively). These facilities were designed to make outright purchases of corporate bonds issued by investment grade US companies, along with US-listed exchange-traded funds (ETFs) that invested in US investment grade corporate bonds. On April 9, these corporate credit facilities were expanded in size and extended to allow for purchases of ETFs that invested in high yield corporate bonds. 3
To study the effects of these interventions on trading conditions, we explore several dimensions of market liquidity. We start with perhaps the most common metric, the bid-ask spread, which Demsetz (1968) [7] famously defined as “the cost of making transactions without delay.’‘ 4 However, in the corporate bond market, dealers actually offer two types of transaction services: “principal trades,” where the customer trades quickly against dealers’ inventory; and”agency trades,” where the customer typically waits for dealers to locate another customer to take the other side of the trade. Principal trades are fast, high quality transaction services as envisioned by Demsetz, while agency trades represent a slower, lower quality version. 5 Naturally, then, the prices of these distinct transaction services can differ significantly, and the frequency with which each type is used can depend on both market conditions and prevailing regulatory requirements.
At the height of the COVID-induced panic, with investors rushing to sell assets as quickly as possible and dealers hesitant to absorb assets directly onto their balance sheets, how much did dealers charge customers to trade immediately via principal trades? What was the cost of trading at a delay, via agency trades, that spared dealers from holding assets on their balance sheets? How did the Fed’s interventions affect dealers’ willingness to accumulate inventory, the price they charged for their transaction services, and the composition of principal vs agency trades? These are the empirical questions that we attempt to answer below, as we provide an account of trading conditions in the corporate bond market that allows for this crucial distinction between different types of transaction services. In the Appendix, we provide a simple theoretical framework to help interpret some of our empirical observations.
The Costs of Trading, Fast and Slow
To capture the average transaction cost for principal trades alone, we calculate the measure of spreads proposed by Choi and Huh (2018) [10] . More specifically, we calculate the average spread between the price that customers pay or receive when trading with a dealer, relative to a reference inter-dealer price, calculated each day for each bond and weighted by trade size. Importantly, we do not include trades in which the dealer who buys the bond from a customer holds it for less than 15 minutes. In doing so, we leave out those trades where the dealer had pre-arranged for another party (either a customer or another dealer) to buy the bond immediately.
To capture the average transaction cost of agency trades, we calculate a modified version of the popular Imputed Roundtrip Costs measure described in Feldhütter (2012) [11] . 6 To construct this modified imputed roundtrip cost (MIRC), we first identify roundtrip trades, defined as two trades in a given bond with the same trade size that take place within 15 minutes of each other: a sale from a customer to a dealer, and a purchase by a customer from a dealer. Then, for each roundtrip trade, we calculate the MIRC as the percentage difference between the maximum and minimum prices. A daily estimate of average roundtrip cost is the average MIRC on that day across bonds, weighted by the value of each trade.
We construct the two series using dealers’ reports to the Trade Reporting Compliance Engine (TRACE), which is made available by the Financial Industry Regulation Authority (FINRA), and plot the output in Figure 1. 7 In all of our plots, we include vertical dashed lines to highlight several key dates: February 19, when stock markets reached their all-time peaks; March 5, which marks the beginning of the extended fall in equity prices and rise in corporate credit spreads; March 9, the first day of trading after Saudi Arabia initiated an oil price war with Russia; March 18, the first day of trading after the announcement of the PDCF; March 23, the day that the PMCCF and SMCCF were announced; and April 9, the day that the size and scope of the corporate credit facilities were expanded.
The two measures of transaction costs are relatively similar, and stable, through February 19. However, the cost of principal trades rises dramatically over the ensuing weeks, while the cost of agency trades is more muted. In particular, between Thursday, March 5, and Monday, March 9, the cost of principal trades roughly triples, to approximately 100 bps; over these three trading days, the S&P 500 Index declined more than 12%. A week later, during the most tumultuous period of March 16-18, this series continues to rise, reaching a peak of more than 200 bps, before beginning a steady decline after the announcement of the SMCCF on March 23. The MIRC measure, in contrast, increases from a baseline of approximately 20 bps to just under 40 bps, before receding back to pre-crisis levels.
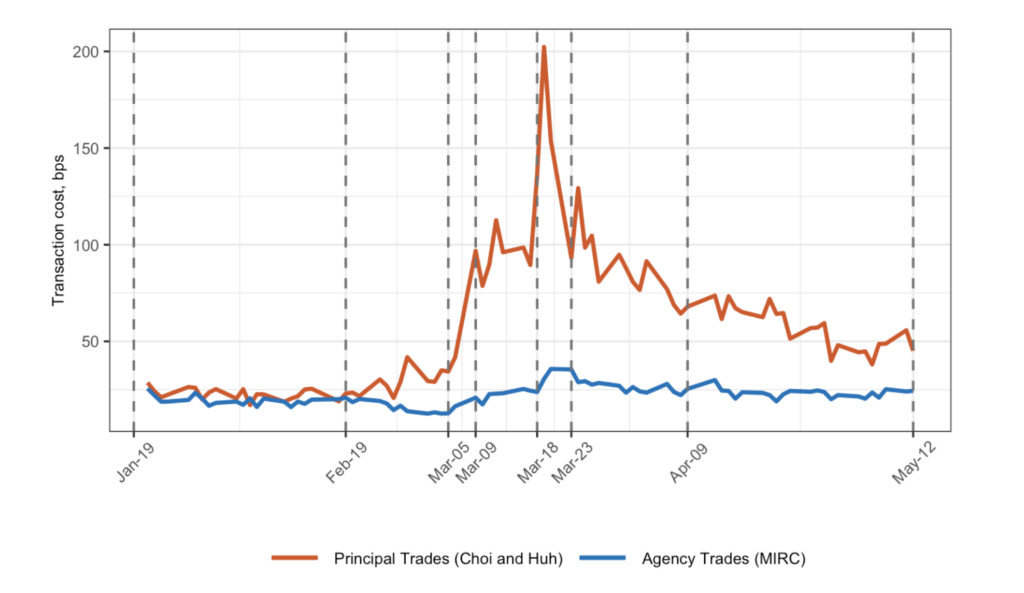
Figure 1: Transaction costs (Choi and Huh (2018) vs MIRC).To highlight the relative costs of principal and agency trades, we plot the ratio of the two series in Figure 2. One can see that the cost of trading immediately was considerably more responsive to both the heightened selling pressure induced by the pandemic in mid-March and the Fed’s interventions which followed. This evidence is broadly consistent with anecdotes from dealers (such as the one in the epigraph) that ascribe a central role to balance sheet costs in the determination of market liquidity. Moreover, despite considerable improvement in both metrics during the month of April, note that the price of trading immediately remains elevated, which suggests that liquidity conditions remain somewhat strained.
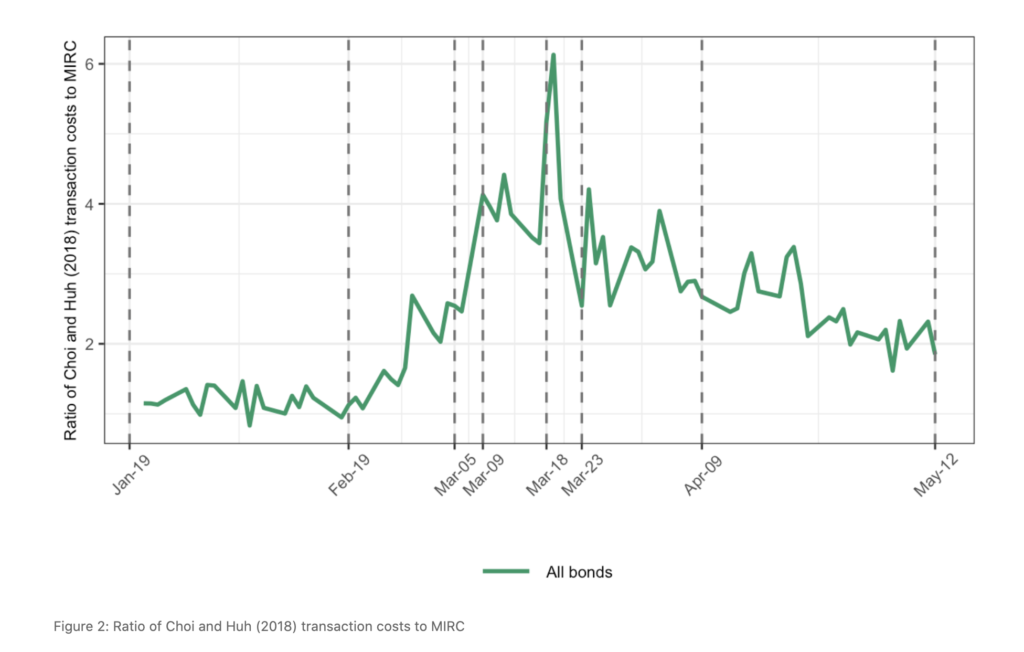
Figure 2: Ratio of Choi and Huh (2018) transaction costs to MIRC
Did Dealers Lean Against the Wind?
Since dealers were charging considerably higher prices to trade immediately, one might expect customers to respond by substituting towards slower, agency trades. Figure 3 confirms that this was indeed the case during the most tumultuous weeks of trading in mid-March. For example, between March 5 and March 23, the fraction of agency trades measured by both number (left axis) and volume (right axis) increased by about 10 percentage points, before receding after the March 23 announcement of the corporate credit facilities. As a result, if one were to measure trading costs across all trades, they would underestimate the erosion in liquidity as the composition of trades shifted from faster, more expensive principal trades to less costly, but slower agency trades.
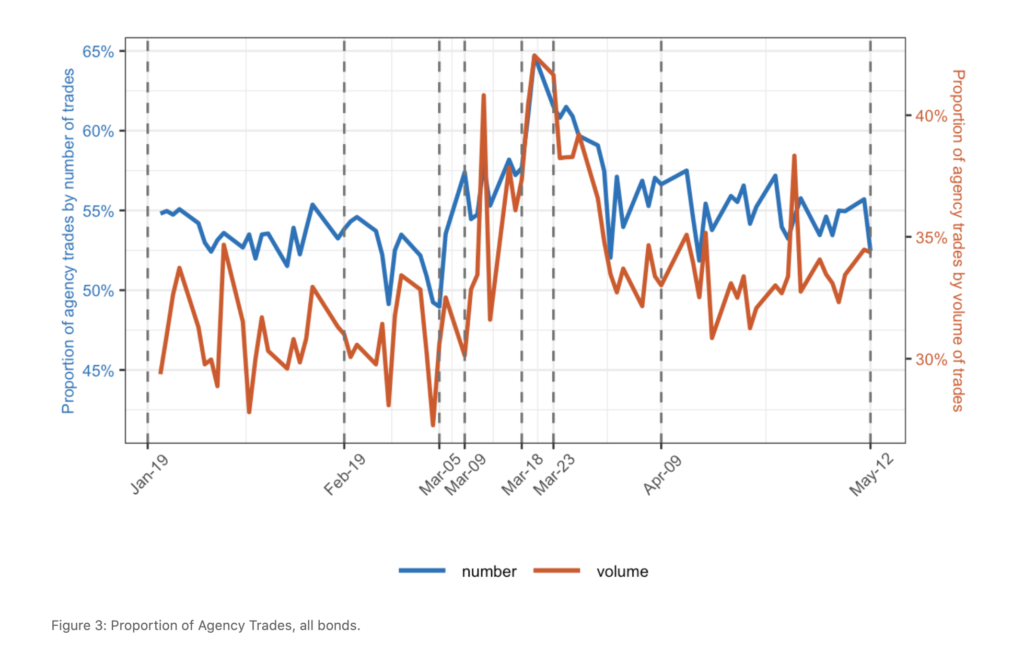
Figure 3: Proportion of Agency Trades, all bonds.
To summarize our results thus far, at the height of massive selling pressure in mid-March—when funds investing in investment-grade corporate bonds faced withdrawals of almost $100 billion alone [12] —the price of trading immediately increased substantially, and the fraction of principal trades declined. In light of these observations, one might naturally wonder: who was providing liquidity in the corporate bond market? Were dealers “leaning against the wind” and absorbing some of the inventory during the selloff, as described in Weill (2007) [13] ? Or was the shift to agency trades sufficiently large that other customers were ultimately providing liquidity?
To answer this question, we construct a measure of the (cumulative) value of bonds that were absorbed over time by the dealer sector. In particular, using the daily Market Sentiment data from FINRA, we subtract the value of bonds that dealers sell to customers from the value of bonds that they buy from customers each day, and then calculate the cumulative sum of the net changes. 8 Figure 4 plots the cumulative net change in inventory held in the dealer sector, both in levels (left axis) and as a fraction of pre-crisis outstanding supply (right axis), starting on February 19, 2020.
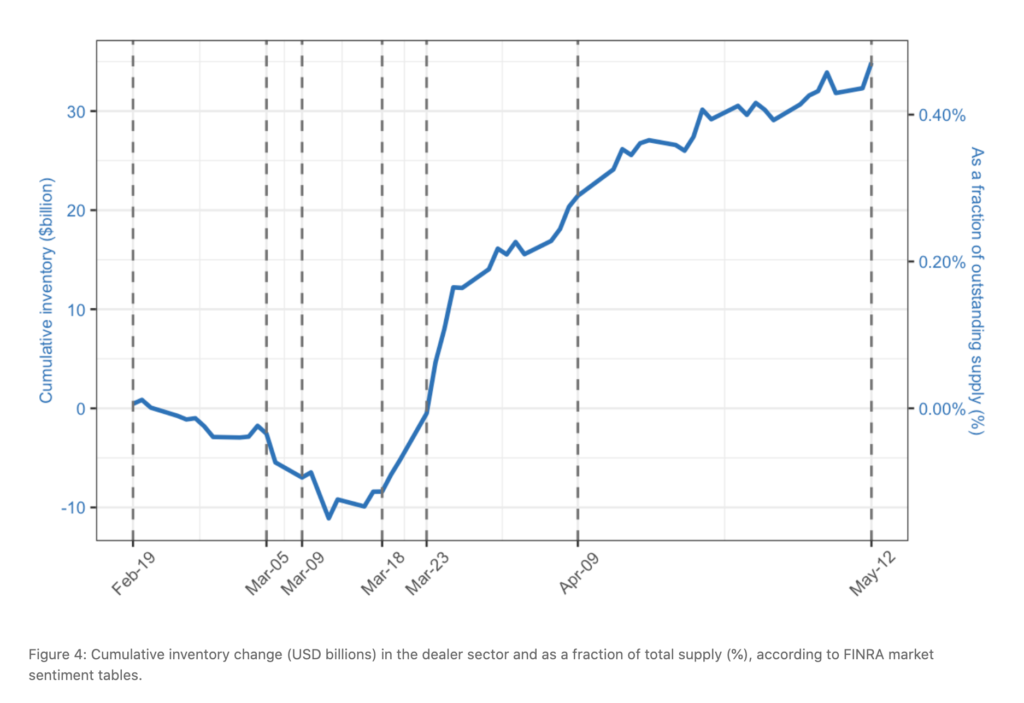
Figure 4: Cumulative inventory change (USD billions) in the dealer sector and as a fraction of total supply (%), according to FINRA market sentiment tables.
Several aspects of Figure 4 are striking. First, during the most tumultuous period of trading, the dealer sector absorbed, on net, no additional inventory despite the considerable selling pressure. Hence, during this period, it was indeed other customers that were supplying liquidity to the market. Second, dealers’ reluctance to absorb inventory appears to have changed substantially around the dates corresponding to the Fed’s announcement of the Primary Dealer Credit Facility (March 18) and the Primary and Secondary Market Corporate Credit Facilities (March 23). Lastly, dealers have continued to accumulate inventory through April and the first half of May. Indeed, since March 18, the data indicates that dealers have absorbed nearly $50 billion in corporate debt, or roughly double the amount they held before the pandemic. 9
Liquidity Across Ratings and Maturity
The evidence above suggests that improvements in corporate bond market liquidity coincided with the announcements of several significant interventions by the Federal Reserve, such as the PMCCF and the SMCCF. When these programs were first announced on March 23, the term sheets specified that the facilities could only purchase investment grade corporate debt with a maturity of five years or less (the possiblity of purchasing ETFs holding high yield corporate debt was introduced later, on April 9). To better understand the sources of illiquidity in the corporate bond market, and the potential effects of these interventions, we now explore the cost of trading eligible and non-eligible bonds since the onset of the pandemic.
To start, Figure 5 plots the Choi and Huh (2018) measure of transaction costs for investment grade (IG) and high yield (HY) corporate bonds (left axis), along with the ratio of the two (right axis). Roughly speaking, the spreads for IG and HY bonds exhibit similar patterns over the sample period: they increase considerably between March 5 and March 23 (with HY bonds issued by firms in the energy sector spiking dramatically on March 9), before gradually receding through April and May. Interestingly, during the week of March 16-20, when markets were most illiquid, IG and HY bonds were equally illiquid. This observation is consistent with anectodal evidence that dealers were unwilling to add any assets to their balance sheets in mid-March. It is inconsistent with, e.g., a theory of illiquidity based on adverse selection, since typically adverse selection would be more severe (and hence spreads would be larger) for more information-sensitive, HY bonds.
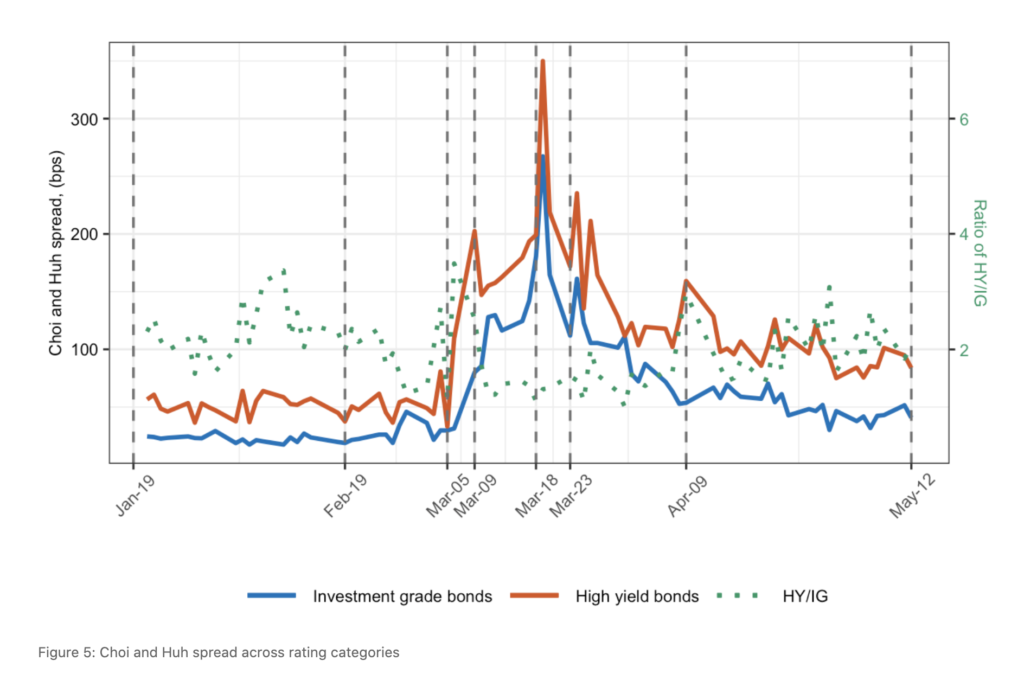
Figure 5: Choi and Huh spread across rating categories
It’s also noteworthy that the announcements of the Fed’s interventions did not have drastically different effects on eligible and non-eligible bonds, as both IG and HY bonds spreads fell significantly after March 23, though the fall was more pronounced for eligible, IG bonds. This observation suggests that bond purchases could have important indirect effects, i.e., that enabling dealers to unload IG bonds from their balance sheet freed them up to intermediate all bonds (and, perhaps, other assets, too). We reach similar conclusions when we examine eligibility restrictions based on maturity. Figure 6 plots the transaction costs of principal trades for bonds with time-to-maturity (TTM) of less than 5 years (which were eligible for purchase by the SMCCF) and more than 5 years (which were not). Again, the ratio of spreads between the two classes of bonds does not indicate that liquidity conditions for eligible bonds improved more drastically than those for ineligible bonds.
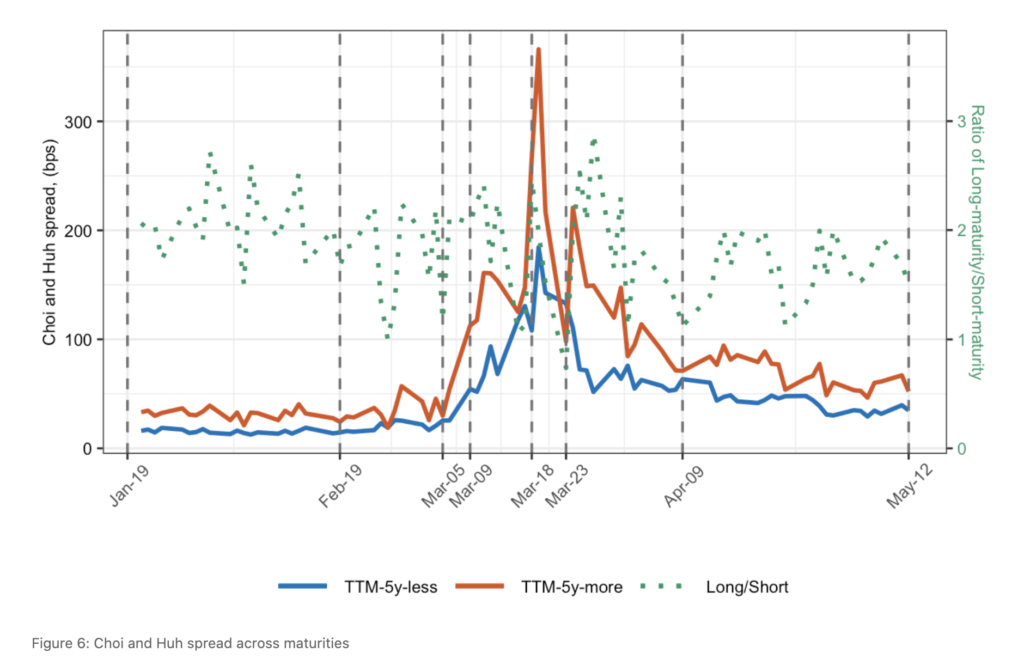
Figure 6: Choi and Huh spread across maturities
Conclusion
This note explores liquidity conditions in the corporate bond market during the COVID-19 pandemic. Liquidity is an important determinant of bond prices and, thus, firms’ issuance and default decisions. 10 Moreover, there are indications that the main source of illiquidity in the corporate bond market—namely, the inability of dealers to absorb inventory onto their balance sheets—was also an important factor in the markets for Treasuries, municipal bonds, and asset-backed securities. 11 Hence, by understanding the behavior of dealers in the corporate bond market, and the effects of the Fed’s various interventions, we hope to provide insight into these other important, dealer-intermediated over-the-counter markets as well.
While the data provides an interesting, real-time assessment of market conditions, much work remains to be done. First, we would like to explore empirical strategies to better determine the causal relationship between policy interventions and market outcomes, as the current analysis is only suggestive, at best. Second, we would like to compare both credit spreads and transaction costs during the recent market turmoil to those observed during the Great Financial Crisis of 2008. By comparing the market’s reaction during these two episodes—which were induced by different shocks amid different regulatory regimes—we hope to shed light on the extent to which each episode should be viewed as a solvency crisis, as opposed to a liquidity crisis.